|
A Pareto Diagram ExampleA Pareto Diagram Example is provided to enhance the pareto principle concept.
The pareto principle prioritizes information. It shows the relative importance of things by charting them from left to right. In many situations eighty percent of effects are within twenty percent of the components measured.
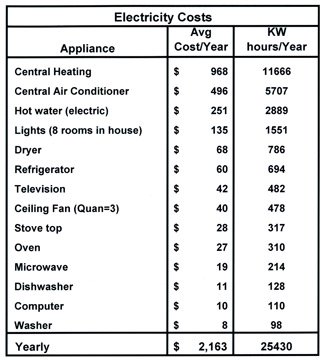
We all use power in our homes or apartments. To save money on this electricity it makes sense to focus efforts on reducing the highest energy users. This can be done by creating a Pareto Diagram of energy costs and usage.Consider fourteen of the top consumers of electricity in a standard home that is 2,100 ft2 with 8 rooms.
• Central heating Following is a breakdown of typical power consumption and cost. This chart shows appliances in order of highest cost and KW electricity usage.#1
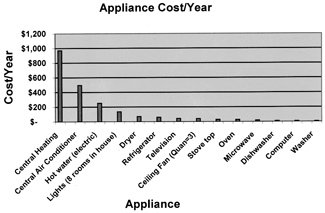
Appliance Costs and Power Usage The following Pareto Diagram graphically shows these costs.
A Pareto Diagram of Appliance Electric Costs This is a good example of the 80/20 rule. Heating, air conditioning and hot water are the biggest users of electricity. They cost $1,715 yearly out of a total electricity cost of $2,163. That’s close to 80% of the cost for three out of the fourteen appliances addressed. To conserve electricity and save money, efforts needs to focus on raising the thermostat temperature in the summer months by a few degrees and lowering it by a few degrees in the winter months. Taking a few less hot showers each month will also save electricity. The Pareto Diagram Example shows that lights are the next biggest users. However, each individual light is a small part of the electric consumption. There are positive side effects to focusing on a problem. Addressing the important effects often leads to addressing the lesser important ones as well. This is known as
the domino effect. 1. The information for electrical usage is from the Tucson Electric Power Company. Your home power will vary due to usage, current rates, house size, and where you live.
Do you want to unlock the power of critical thinking and create an amazing future? If so, click the link and get your copy of Mastering Critical Thinking today! |


